Executive summary
Stocktake during a year of broken records
The world is witnessing a disturbing acceleration in the number, speed and scale of broken climate records. At the time of writing, 86 days have been recorded with temperatures exceeding 1.5°C above pre-industrial levels this year. Not only was September the hottest month ever, it also exceeded the previous record by an unprecedented 0.5°C, with global average temperatures at 1.8°C above pre-industrial levels. These records were accompanied by devastating extreme events, which the Intergovernmental Panel on Climate Change (IPCC) has warned us are merely a meek beginning. While the records do not imply that the world has exceeded the 1.5°C temperature limit specified in the Paris Agreement, which refers to global warming levels based on multi-decadal averages, they signal that we are getting closer.
This fourteenth Emissions Gap Report is published ahead of the twenty-eighth session of the Conference of the Parties to the United Nations Framework on Climate Change (COP 28). It provides an annual, independent science-based assessment of the gap between the pledged greenhouse gas (GHG) emissions reductions and the reductions required to align with the long-term temperature goal of the Paris Agreement, as well as opportunities to bridge this gap. COP 28 marks the conclusion of the first global stocktake under the Paris Agreement, held every five years to assess the global response to the climate crisis and chart a better way forward. This closely mirrors the objective of the Emissions Gap Report, and the report aims to provide findings relevant to the concluding discussions under the global stocktake.
To inform COP 28 – including on the outcomes needed from the global stocktake – and set the scene for the next round of nationally determined contributions (NDCs) that countries are requested to submit in 2025, which will include emissions reduction targets for 2035, this report looks at what is required this decade and beyond 2030 to maintain the possibility of achieving the long-term temperature goal of the Paris Agreement. It underscores that maintaining this possibility hinges on relentlessly strengthening mitigation action this decade to narrow the emissions gap. This will facilitate significantly more ambitious targets for 2035 in the next round of NDCs, and pave the way for enhancing the credibility and feasibility of the net-zero pledges that by now cover around 80 per cent of global emissions. Failure to bring global GHG emissions in 2030 below the levels implied by current NDCs will make it impossible to limit warming to 1.5°C with no or limited overshoot and strongly increase the challenge of limiting warming to 2°C.
As this report shows, not only temperature records continue to be broken – global GHG emissions and atmospheric concentrations of carbon dioxide (CO2) also set new records in 2022. Due to the failure to stringently reduce emissions in high-income and high-emitting countries (which bear the greatest responsibility for past emissions) and to limit emissions growth in low- and middle-income countries (which account for the majority of current emissions), unprecedented action is now needed by all countries. For high-income countries, this implies further accelerating domestic emissions reductions, committing to reaching net zero as soon as possible – and sooner than the global averages from the latest IPCC report implies – and at the same time providing financial and technical support to low- and middle-income countries. For low- and middle-income countries, it means that pressing development needs must be met alongside a transition away from fossil fuels. Furthermore, the delay in stringent mitigation action will likely increase future dependence on carbon dioxide removal (CDR) from the atmosphere, but availability of large-scale CDR options in the future cannot be taken for granted. This year, the report thus explores opportunities and challenges associated with energy transitions as well as development and deployment of CDR.
Key Message 1. Global GHG emissions set new record of 57.4 GtCO2e in 2022
- Global GHG emissions increased by 1.2 per cent from 2021 to 2022 to reach a new record of 57.4 gigatons of CO2 equivalent (GtCO2e) (figure ES.1). All sectors apart from transport have fully rebounded from the drop in emissions induced by the COVID-19 pandemic and now exceed 2019 levels. CO2 emissions from fossil fuel combustion and industrial processes were the main contributors to the overall increase, accounting for about two thirds of current GHG emissions. Emissions of methane (CH4), nitrous oxide (N2O) and fluorinated gases (F-gases), which have higher global warming potentials and account for about one quarter of current GHG emissions, are increasing rapidly: in 2022, F-gas emissions grew by 5.5 per cent, followed by CH4 at 1.8 per cent and N2O at 0.9 per cent. Based on early projections, global net land use, land-use change and forestry (LULUCF) CO2 emissions remained steady in 2022. LULUCF CO2 emissions and removals continue to have the largest uncertainties of all gases considered, both in terms of their absolute amounts and trends.
- GHG emissions across the G20 also increased by 1.2 per cent in 2022. However, members vary widely in their trends with increases in China, India, Indonesia and the United States of America, but decreases in Brazil, the European Union and the Russian Federation. Collectively, the G20 currently account for 76 per cent of global emissions.
Figure ES.1: Total net anthropogenic GHG emissions, 1990–2022
Figure ES.1Total net anthropogenic GHG emissions, 1990–2022
- Global primary energy consumption expanded in 2022 – an expansion mainly met by a growth in coal, oil and renewable electricity supply – whereas gas consumption declined by 3 per cent following the energy crisis and the war in Ukraine. Overall, net electricity demand growth in 2022 was primarily met by renewable sources (excluding hydropower), driven by a record increase in solar capacity additions. Nonetheless, investments in fossil fuel extraction and use have continued in most regions worldwide. Globally, Governments still plan to produce more than double the amount of fossil fuels in 2030 than would be consistent with the long-term temperature goal of the Paris Agreement.
Key Message 2. Current and historical emissions are highly unequally distributed within and among countries, reflecting global patterns of inequality
- Per capita territorial GHG emissions vary significantly across countries. They are more than double the world average of 6.5 tons of CO2 equivalent (tCO2e) in the Russian Federation and the United States of America, while those in India remain under half of it. Per capita emissions are fairly similar in Brazil, the European Union and Indonesia, and at levels slightly below the G20 average. The G20 as a group averaged 7.9 tCO2e, whereas least developed countries averaged 2.2 tCO2e and small island developing States averaged 4.2 tCO2e.
- Inequality in consumption-based emissions is also found among and within countries. Globally, the 10 per cent of the population with the highest income accounted for nearly half (48 per cent) of emissions with two thirds of this group living in developed countries. The bottom 50 per cent of the world population contributed only 12 per cent of total emissions.
- Historic emissions and contribution to global warming similarly vary significantly across countries and groups of countries (figure ES.2). Nearly 80 per cent of historical cumulative fossil and LULUCF CO2 emissions came from G20 countries, with the largest contributions from China, the United States of America and the European Union, while least developed countries contributed 4 per cent. The United States of America account for 4 per cent of current world population, but contributed 17 per cent of global warming from 1850 to 2021, including the impact of methane and nitrous oxide emissions. India, by contrast, accounts for 18 per cent of the world population, but to date only contributed 5 per cent of warming.
Figure ES.2: Current and historic contributions to climate change
Figure ES.2Current and historic contributions to climate change
Key Message 3. There has been negligible movement on NDCs since COP 27, but some progress in NDCs and policies since the Paris Agreement was adopted
- Nine countries have submitted new or updated NDCs since COP 27, bringing the total number of NDCs that have been updated since the initial NDCs were submitted in advance of or following the Paris Agreement to 149 (counting the European Union and its 27 Member States as a single Party) as at 25 September 2023. More NDCs now contain GHG reduction targets, and more of these targets are economy-wide, covering a country's entire economy as opposed to certain sectors only.
- If all new and updated unconditional NDCs are fully implemented, they are estimated to reduce global GHG emissions by about 5.0 GtCO2e (range: 1.8–8.2 GtCO2e) annually by 2030, compared with the initial NDCs. The combined effect of the nine NDCs submitted since COP 27 amounts to around 0.1 GtCO2e of this total. Thus, while NDC progress since COP 27 has been negligible, progress since the adoption of the Paris Agreement at COP 21 is more pronounced, although still insufficient to narrow the emissions gap.
- Progress since the Paris Agreement is clearer on the policy side. Globally, GHG emissions in 2030 based on policies in place were projected to increase by 16 per cent at the time of the adoption of the Paris Agreement. Now the projected increase is 3 per cent.
- Policy progress has contributed to reducing the implementation gap, defined as the difference
- between projected emissions under current policies and projected emissions under full implementation of the NDCs. The global implementation gap for 2030 is estimated to be around 1.5 GtCO2e for the unconditional NDCs (down from 3 GtCO2e in last year's assessment) and 5 GtCO2e for the conditional NDCs (down from 6 GtCO2e last year). The implementation gap for the G20 members has also been reduced. As a group, the G20 members are projected to fall short of their new and updated NDCs by 1.2 GtCO2e annually by 2030, which is 0.6 GtCO2e lower than last year's assessment (figure ES.3). The impact of newly implemented policies is a main driver of both lower global and G20 emission projections for 2030. Other factors include changes in emission trends and socioeconomic circumstances.
Figure ES.3: Implementation gaps between current policies and NDC pledges for the G20 members collectively and individually by 2030, relative to 2015 emissions
Figure ES.3Implementation gaps between current policies and NDC pledges for the G20 members collectively and individually by 2030, relative to 2015 emissions
Key Message 4. The number of net-zero pledges continues to increase, but confidence in their implementation remains low
- As at 25 September 2023, 97 Parties covering approximately 81 per cent of global GHG emissions had adopted net-zero pledges either in law (27 Parties), in a policy document such as an NDC or a long-term strategy (54 Parties), or in an announcement by a high-level government official (16 Parties). This is up from 88 Parties last year. A total of 37 per cent of global GHG emissions are covered by net-zero targets for 2050 or earlier, while 44 per cent of global emissions are covered by net-zero pledges for years later than 2050.
- Responsible for 76 per cent of global emissions, G20 members will dominate when global emissions reach net zero. Encouragingly, all G20 members except Mexico have set net-zero targets, and over the past year, some members have taken important steps towards strengthening and implementing their targets. Overall, however, limited progress has been made on key indicators of confidence in net-zero implementation among G20 members, including legal status, the existence and quality of implementation plans, and alignment of near-term emissions trajectories with net-zero targets. Most concerningly, none of the G20 members are currently reducing emissions at a pace consistent with meeting their net-zero targets.
Key Message 5. The emissions gap in 2030 remains high: current unconditional NDCs imply a 14 GtCO2e gap for a 2°C goal and a 22 GtCO2e gap for the 1.5°C goal. The additional implementation of the conditional NDCs reduces these estimates by 3 GtCO2e
- The emissions gap is defined as the difference between the estimated global GHG emissions resulting from full implementation of the latest NDCs and those under least-cost pathways aligned with the long-term temperature goal of the Paris Agreement.
- These least-cost pathways assume stringent emissions reductions starting in 2020, which current trends contradict. Since emissions today are higher than in 2020, this implies that the world has already further depleted the limited remaining carbon budget and committed to slightly higher global warming than indicated by the least-cost pathways, unless there is further acceleration of emissions reductions after emissions levels consistent with the least-cost pathways are met. The emissions gap estimates are thus likely to be lower-bound, as they do not account for the excess emissions since 2020 compared with the least-cost pathways, and should be read with this caveat in mind.
- The emissions gap for 2030 remains largely unchanged compared with last year's assessment. Full implementation of unconditional NDCs is estimated to result in a gap with below 2°C pathways of about 14 GtCO2e (range: 13–16) with at least 66 per cent chance. If the conditional NDCs are also fully implemented, the below 2°C emissions gap is reduced to 11 GtCO2e (range: 9–15) (table ES.1 and figure ES.4).
Table ES.1 Global total GHG emissions in 2030, 2035 and 2050, and estimated gaps under different scenarios
|
Scenario |
GHG emissions (GtCO2e) |
Estimated gap to least-cost pathways consistent with limiting global warming to specific levels (GtCO2e) |
||
|
Median and range |
Below 2°C |
Below 1.8°C |
Below 1.5°C |
|
|
2030 |
||||
|
Current policies |
56 (52–60) |
16 (11–19) |
22 (17–25) |
24 (19–27) |
|
Unconditional NDCs |
55 (54–57) |
14 (13–16) |
20 (19–22) |
22 (21–24) |
|
Conditional NDCs |
52 (50–55) |
11 (9–15) |
17 (15–20) |
19 (17–23) |
|
2035 |
||||
|
Current policies continued |
56 (45–64) |
20 (9–28) |
29 (18–37) |
31 (20–39) |
|
Unconditional NDCs continued |
54 (47–60) |
18 (11–25) |
27 (20–34) |
29 (22–36) |
|
Conditional NDCs continued |
51 (43–58) |
15 (8–22) |
24 (17–31) |
26 (19–33) |
|
2050 |
||||
|
Current policies continued |
55 (24–72) |
35 (4–52) |
43 (12–60) |
46 (16–63) |
|
Unconditional NDCs and net-zero pledges using strict criteria |
44 (26–58) |
24 (6–38) |
32 (14–46) |
36 (18–49) |
|
Conditional NDCs and all net-zero pledges |
21 (6–33) |
1 (-14–13) |
9 (-6–21) |
12 (-2–25) |
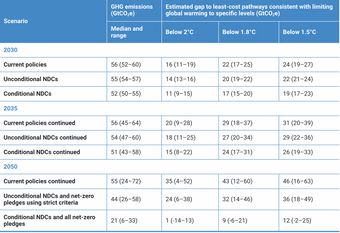
Figure ES.4: Global GHG emissions under different scenarios and the emissions gap in 2030 and 2035 (median estimate and tenth to ninetieth percentile range)
Figure ES.4Global GHG emissions under different scenarios and the emissions gap in 2030 and 2035 (median estimate and tenth to ninetieth percentile range)
- The emissions gap in 2030 between unconditional NDCs and 1.5°C pathways is about 22 GtCO2e (range: 21–24) with at least 50 per cent chance. If the conditional NDCs are also fully implemented, the 1.5°C emissions gap is reduced to 19 GtCO2e (range: 17–23).
- Unconditional and conditional NDCs for 2030 are estimated to reduce global emissions by 2 per cent and 9 per cent respectively, compared with current policy projections and assuming they are fully implemented. To get to levels consistent with least-cost pathways limiting global warming to below 2°C and 1.5°C, global GHG emissions must be reduced by 28 per cent and 42 per cent respectively. This is 2 percentage points lower than last year's assessment, illustrating the progress in narrowing the implementation gap between current policies and NDCs.
- Nonetheless, immediate, accelerated and relentless mitigation action is needed to bring about the deep annual emission cuts that are required from now to 2030 to narrow the emissions gap, with unparalleled annual cuts required to bridge the gap, even without accounting for excess emissions since 2020.
Key Message 6. Action in this decade will determine the ambition required in the next round of NDCs for 2035, and the feasibility of achieving the long-term temperature goal of the Paris Agreement
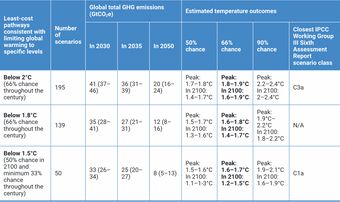
- The first global stocktake under the Paris Agreement is envisaged to inform the next round of NDCs that countries are requested to submit in 2025, which will include targets for 2035. Overall, global ambition in the next round of NDCs must be sufficient to bring global GHG emissions in 2035 to the levels consistent with below 2°C and 1.5°C pathways of 36 GtCO2e (range: 31–39) and 25 GtCO2e (range: 20–27) respectively (table ES.2), while also compensating for excess emissions until levels consistent with these pathways are achieved.
- In contrast, a continuation of current policies and NDC scenarios would result in widened and likely unbridgeable gaps in 2035 (table ES.1). A continuation of current policies is projected to result in global GHG emissions of 56 GtCO2e in 2035 (table ES.1), which is 36 per cent and 55 per cent higher than the levels consistent with below 2°C and 1.5°C pathways respectively (table ES.2), without compensating for excess emissions.
- Again, these findings underline that immediate and unprecedented mitigation action in this decade is essential. Over-complying with current NDC targets for 2030 will enable countries to put forward more ambitious mitigation targets for 2035 in their next NDCs, and it will make the realization of such ambitious targets for 2035 more feasible.
- Looking beyond 2035 at mid-century scenarios (table ES.1) reinforces these findings and points to the necessity of enhancing the credibility and feasibility of net-zero pledges. Total global GHG emissions in 2050 are only brought closer to 1.5°C and 2°C pathways if the conditional NDCs are fully implemented in combination with the achievement of all net-zero pledges.
Table ES.2 Global GHG emissions in 2030, 2035 and 2050, and global warming characteristics of least-cost pathways starting in 2020 consistent with limiting global warming to specific temperature limits
|
Least-cost pathways consistent with limiting global warming to specific levels |
Number of scenarios |
Global total GHG emissions (GtCO2e) |
Estimated temperature outcomes |
|||||
|
In 2030 |
In 2035 |
In 2050 |
50% chance |
66% chance |
90% chance |
Closest IPCC Working Group III Sixth Assessment Report scenario class |
||
|
Below 2°C |
195 |
41 (37–46) |
36 (31–39) |
20 (16–24) |
Peak: 1.7–1.8°C In 2100: 1.4–1.7°C |
Peak:
In 2100: |
Peak: In 2100: |
C3a |
|
Below 1.8°C |
139 |
35 (28–41) |
27 (21–31) |
12 (8–16) |
Peak: In 2100: |
Peak:
In 2100: |
Peak: In 2100: |
N/A |
|
Below 1.5°C |
50 |
33 (26–34) |
25 (20–27) |
8 (5–13) |
Peak: In 2100: |
Peak:
In 2100: |
Peak: In 2100: |
C1a |
Key Message 7. If current policies are continued, global warming is estimated to be limited to 3°C. Delivering on all unconditional and conditional pledges by 2030 lowers this estimate to 2.5°C, with the additional fulfilment of all net-zero pledges bringing it to 2°C
- A continuation of the level of climate change mitigation efforts implied by current policies is estimated to limit global warming to 3°C (range: 1.9–3.8°C) throughout the century with a 66 per cent chance. Warming is expected to increase further after 2100 as CO2 emissions are not yet projected to reach net-zero levels.
- A continuation of the unconditional NDC scenario lowers this estimate to 2.9°C (range: 2–3.7°C), whereas the additional achievement and continuation of conditional NDCs lowers this by around 0.4°C to 2.5°C (range: 1.9–3.6°C).
- In the most optimistic scenario where all conditional NDCs and net-zero pledges, including those made as part of long-term low-emissions development strategies, are assumed to be fully achieved, global warming is projected to be limited to 2°C (range: 1.8–2.5°C) with 66 per cent chance over the course of the century. However, as noted previously, net-zero pledges remain highly uncertain.
- Even in the most optimistic scenario considered in this report, the chance of limiting global warming to 1.5°C is only 14 per cent, and the various scenarios leave open a large possibility that global warming exceeds 2°C or even 3°C. This further illustrates the need to bring global emissions in 2030 lower than levels associated with full implementation of the current NDCs, to expand the coverage of net-zero pledges to all GHG emissions and to achieve these pledges.
- Central temperature projections are slightly higher than in the 2022 edition of the Emissions Gap Report, as a larger number of models have been included in the estimation of future emissions. However, the projections are consistent with those from other major assessments, such as the International Energy Agency's 2023 Announced Pledges Scenario, the Climate Action Tracker and the United Nations Framework Convention on Climate Change 2023 NDC Synthesis Report, noting that these report temperature projections with a 50 per cent rather than a 66 per cent chance.
Key Message 8. The failure to stringently reduce emissions in high-income countries and to prevent further emissions growth in low- and middle-income countries implies that all countries must urgently accelerate economy-wide, low-carbon transformations to achieve the long-term temperature goal of the Paris Agreement
- Delivering transformational change requires unprecedented global cooperation reflecting the Paris Agreement principle of common but differentiated responsibilities and respective capabilities in light of national circumstances. This principle implies that countries with greater capacity and greater historic responsibility for emissions – particularly high-income and high-emitting countries among the G20 – will need to take more ambitious and rapid action, setting the course and demonstrating the viability of fossil-free development. However, this will not be sufficient as low- and middle-income countries already account for more than two thirds of global GHG emissions. Accordingly, the Climate Solidarity Pact proposed by the United Nations Secretary-General calls on all big emitters to make extra efforts to cut emissions and wealthier countries to provide financial and technical resources to support low- and middle-income countries in their transformation, reflecting differentiated timelines.
- Energy is the dominant source of GHG emissions, currently accounting for 86 per cent of global CO2 emissions. The coal, oil and gas extracted over the lifetime of producing and under-construction mines and fields as at 2018 would emit more than 3.5 times the carbon budget available to limit warming to 1.5°C and almost the entire budget available for 2°C (figure ES.5). Global transformation of energy systems is thus essential, including in low- and middle-income countries, where pressing development objectives must be met alongside a transition away from fossil fuels.
Figure ES.5: Committed CO2 emissions from existing fossil fuel infrastructure, compared with carbon budgets reflecting the long-term temperature goal of the Paris Agreement
Figure ES.5Committed CO2 emissions from existing fossil fuel infrastructure, compared with carbon budgets reflecting the long-term temperature goal of the Paris Agreement
Key Message 9. Low- and middle-income countries face substantial economic and institutional challenges in low-carbon energy transitions, but can also exploit opportunities
- Energy transitions in low- and middle-income countries are shaped by the overarching objective of pursuing development. Low- and middle-income countries face several common challenges in having to bring millions out of poverty, expand strategic industries, urbanize and deal with the political challenges of a transition away from fossil fuel use. Meeting basic energy needs of people living in poverty would have a limited impact on global GHG emissions. Yet today, 2.4 billion people lack access to clean cooking and 775 million to electricity, with women and children disproportionately affected. Meeting energy needs for broader human development will lead to significant energy demand growth, but there is scope to meet this growth more efficiently and equitably, and with low-carbon energy as renewables get cheaper.
- National circumstances vary with natural resource endowments and economic conditions, and will shape energy transition pathways. Capacity and institutions are often weak in low- and middle-income countries, and they may face different and additional political economic challenges from high-income countries, especially in view of the required speed of transition.
- Low- and lower-middle-income countries are in the greatest need of affordable finance as they are already saddled with debt, receive disproportionately low clean energy investments, are more vulnerable to volatile fossil fuel markets either as exporters or importers, and may face future stranded fossil fuel assets. Upper-middle-income countries are typically further along in building clean energy economies, but still face risks of stranded assets and related employment implications and macroeconomic shocks.
- Access to affordable finance is therefore a prerequisite for increasing mitigation ambition in low- and middle-income countries. Yet, costs of capital are up to seven times higher in these countries compared with the United States of America and Europe (figure ES.6 ). International financial assistance will therefore have to be significantly scaled up from existing levels, and new public and private sources of capital better distributed towards low-income countries, restructured through financing mechanisms that lower costs of capital. These include debt financing, increasing long-term concessional finance, guarantees and catalytic finance.
Figure ES.6: Weighted average cost of capital for solar photovoltaic projects against per capita gross national income for select countries in 2021
Figure ES.6 Weighted average cost of capital for solar photovoltaic projects against per capita gross national income for select countries in 2021
- Low- and middle-income countries can take ownership of their low-carbon development agenda by laying out national low-carbon development strategies suited to their national context, including by adopting measures in key energy-intensive demand sectors, such as housing, transport and food, which have known synergies between climate mitigation and human development. This will require strengthening domestic energy and climate institutions to undertake strategic planning and enhanced coordination across sectors. Furthermore, strong stakeholder engagement is needed to ensure just outcomes and economic diversification.
- The preparation of the next round of NDCs offers an opportunity for low- and middle-income countries to develop nationally driven road maps with broad domestic visions for ambitious development and climate policies and targets, for which implementation progress can be measured, finance and technology needs are clearly specified, and detailed investment-ready implementation plans are prepared. With less than two years left until the next round of NDCs are due, COP 28 would be a timely occasion to call for international support to prepare such robust and ambitious NDCs that integrate development and climate objectives.
Key Message 10. Further delay of stringent global GHG emissions reductions will increase future reliance on CDR to meet the long-term temperature goal of the Paris Agreement
- Immediate and stringent emissions reductions are required to bridge the emissions gap and maintain the feasibility of achieving the long-term temperature goal of the Paris Agreement. All least-cost pathways starting in 2020 consistent with meeting this goal require immediate and deep emission cuts as well as a growing quantum of CDR over time (figure ES.7). With the delay in stringent mitigation action, the need for CDR in the longer term will likely increase even further.
- CDR is necessary to achieve the long-term goal of the Paris Agreement as reaching net-zero CO2 emissions is required to stabilize global warming, whereas net-zero GHG emissions will result in a peak and decline in global warming. Since it is impossible to fully eliminate all CO2 or other GHG emissions through stringent emissions reductions, residual emissions must be balanced by removals from the atmosphere, i.e. through CDR, to reach net-zero emissions.
Figure ES.7: The role of emissions reductions and CDR in least-cost pathways consistent with the long-term temperature goal of the Paris Agreement
Figure ES.7The role of emissions reductions and CDR in least-cost pathways consistent with the long-term temperature goal of the Paris Agreement
- CDR is already deployed today – mainly in the form of conventional land-based methods, such as afforestation, reforestation and management of existing forests, with a large share located in developing countries. Present-day direct removals through conventional land-based methods are estimated to be 2.0 (±0.9) GtCO2 annually, almost entirely through conventional land-based methods. Direct removals through novel CDR methods, such as bioenergy with carbon capture and storage, biochar, direct air carbon capture and storage, and enhanced weathering, are currently miniscule at 0.002 GtCO2 annually. Direct removals through novel CDR methods, such as direct air carbon capture and storage, and enhanced weathering, are currently miniscule at 0.002 GtCO2 annually.
- Nonetheless, 1.5°C and 2°C least-cost pathways assume significant increases in both conventional and novel CDR over time (figure ES.7). Conventional CDR grows to up to 6 GtCO2 annually by 2050 under these pathways and novel CDR up to 4 GtCO2 annually by 2050. Conventional land-based CDR plays a stronger role in the near- and mid-term, while novel CDR plays a stronger role later in the century to reach net-negative emissions, noting that levels depend on the underlying economic and technological assumptions as well as the magnitude of temperature drawdown after achieving net-zero CO2 emissions.
- Achievement of the gigaton levels of CDR implied later in this century by pathways consistent with the Paris Agreement is uncertain and associated with several risks. Increased reliance on conventional land-based CDR is risky due to issues of land competition, protection of Indigenous and traditional communities' land tenure and rights, and sustainability, biodiversity and permanence risks of forest-based CDR, including from forest fires and other disturbances. Novel CDR methods are generally at an early stage of development and are associated with different types of risks, including that the technical, economic and political requirements for large-scale deployment may not materialize in time. Furthermore, public acceptance is still uncertain, particularly for approaches involving carbon capture and storage, or the open ocean. These risks can negatively affect the prospects for scale-up, despite technical potentials.
- To spur innovation and enable scaling up of novel CDR technologies, these technologies will first need to go through a formative phase, which will require strong policy and financial support. Given the time it takes to mature technologies, the next decade will be crucial for novel CDR methods. Failure to create momentum in this formative phase will result in a widening discrepancy between the levels of novel CDR needed and available by 2050 and beyond.
- This points to four important areas for political action:
- Setting and signalling CDR priorities
- Developing robust measurement, reporting and verification systems to enhance credibility
- Harnessing synergies and co-benefits with other efforts
- Accelerating innovation.